Environmental Awareness
A Healthy Environment
-
Sustainability
-
Resource Plan
-
SDG 13: Climate Action, SDG 3: Good Health and Well-Being, SDG 7: Affordable and Clean Energy
-
8 - 9 years
-
Arabic, English, Geography, Maths
-
Resource ID: 17020
- Share Feedback Embed Resource
Overarching Goal(s)
- To equip learners with the knowledge, skills, motivation and understanding to demonstrate the importance of Glocalization as a sustainable model for learning.
- To inspire students to act sustainably from both local and global perspectives.
Learning Outcomes
- Learners develop lifelong skills which support their sustainable actions.
- Learners reflect on the impact of their actions and demonstrate their understanding of the action as related to sustainability.
Possible Duration (Hours)
6 hours
Sustainable Development Goals (SDGs) Connection
SDG 3: Good Health and Well-Being: This lesson tool demonstrates and makes connections to clean environmental areas where air pollutants are low, which promotes and sustains the good health and well-being of citizens, residents, and visitors in Qatar.
SDG 7: Affordable and Clean Energy: Solutions such as electric cars, and solar panels throughout cities in Doha contribute to cleaner energy and sustainability.
SDG 13: Climate action: The statistical data demonstrates that climate action provides low levels of air pollutants throughout the cities to provide clean and sustainable environments.
The 17 Sustainable Development Goals
(Source: United Nations)
English: https://sdgs.un.org/goals
Arabic: https://sdgs.un.org/ar/goals
Action Learning Outcomes
- Learners become more aware of their own strengths and areas for growth.
- Learners undertake challenges that develop new skills.
- Learners persevere in action.
- Learners work collaboratively with others.
- Learners consider the ethical implications of their actions.
Content
The content of the lesson tool revolves around air pollutants and interpreting; analyzing air pollutants statistical data collated by the Ministry of Environment and Climate Change.
Resource Utilization and Identification: Ministry of Environment and Climate Change.
Subject Matter: Geographical locations in Doha, interpretation and analyzing data statistics, and Language(s).
Glocalization Connections: Kinds of pollution that exist locally and globally.
Differentiation: Mixed ability groups where higher ability students can support lower and middle ability students to understand concepts using the Arabic language or by giving further examples.
Critical Thinking: Encourage students to analyze the implications of air pollutants that have on the environment and health; well-being and ways to sustain and contribute to cleaner, healthier cities.
Real-world Application: Students discuss and explain how we are responsible for keeping our environment clean and suggest ways in which promotes to sustain clean air and energy.
Strategies
The strategies employed in this lesson tool are designed to foster analyzing, critical thinking, inquiry, collaboration, and innovative engagement. They include visible thinking routines, responsive pedagogy, and problem-solving approaches to adapt to students’ needs and encourage active participation. Students apply meaningful learning experiences that connect to the sustainability of cleaner air in Qatar.
Responsive and Adaptive Pedagogy: Adjust the pace and level of guidance based on student responses and engagement.
Visible Thinking Routines: Implementing the “See-Think-Wonder” strategy encourages students to analyze, interpret and inquire about the topic.
Inquiry: Encourage students to inquire about the significance of the statistical data for air transporters, travelers, residents and visitors.
Collaboration: Facilitate a class discussion forum where students can share and compare their perceptions, promoting collaboration and the exchange of diverse perspectives.
Assessment for and as Learning: Use formative assessments for student responses and presentations.
Problem-Solving: Ask students to identify and propose solutions to challenges in climate and environmental surroundings.
Learning Experiences
Learning Engagement 1: Identifying and understanding the impact of air pollution.
Learning Objective: To identify and understand the impact of air pollution.
Introduction and context setting
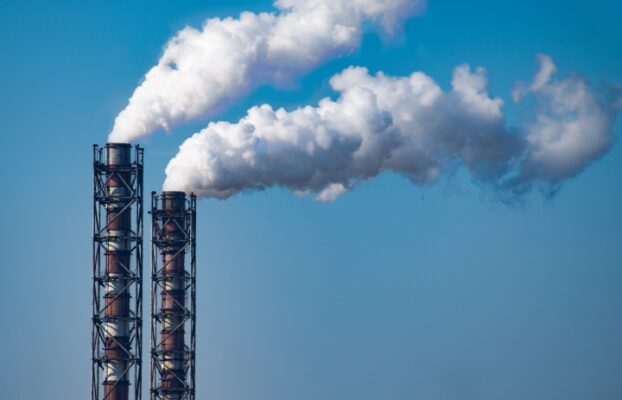
Students will use the ‘See-Think-Wonder’ visible routine that encourages students to observe, interpret and inquire about our environment and health issues, suggesting solutions and responsible positive actions.
Resource 1: See, Think, Wonder Activity: https://rasekh.qa/wp-content/uploads/2024/08/Resource-1_-See-Think-and-Wonder-Activity.pdf
See – What do you notice is happening in the image?
Think – In what ways do you think this may cause some problems for our health and environment?
Wonder – What can be some consequences if we do not take responsible action to prevent these things happening around us? What are some positive solutions?
Reflection:
Students will share some of their responses with the rest of the class.
Teacher instructions for students:
The teacher will explain and emphasize to the students that clean air is healthy for us to breathe. Air can become polluted, that is contaminated with particles and gases that makes the air dirty and unhealthy. Air pollution consists of any visible or invisible gas or particle found in the air which is not part of the air’s normal composition. While some of the air has natural causes, most come from man-made sources.
Activity 1: Identifying Air Pollution
Resource 2: Environment Scenarios: https://rasekh.qa/wp-content/uploads/2024/08/Resource-2_-Environment-scenarios.pdf
The teacher will print resource 2 and put each scenario on a separate card with an A3 blank sheet of white paper, fine colored markers, and colored pencils. Then the teacher will distribute a scenario to each group. The teacher will explain that each group will read their scenario, and in each group there can be two readers and two experts to explain the scenario from what they heard their peers read. Then they will discuss and collaborate by answering the questions from their scenario card. They can illustrate and write their responses on their A3 blank sheet of white paper.
Reflection
Each pair will share their responses and illustrations with the rest of the class. Each group will have a different scenario to share and listen to. The teacher will emphasize the significance of sustaining a healthy environment connecting to some of the student’s good examples.
Learning Engagement 2: Interpreting and analyzing environmental statistical data
Learning Objective: To interpret and analyze environmental statistical data
The teacher will show page 6 of Resource 2 to the students and explain the Pollutants and what each description of Air Pollutants Indicator. The two forms are particulate (visible) and gaseous (invisible).
Resource 3: Ministry and Environment and Climate Change Statistics: https://rasekh.qa/wp-content/uploads/2024/08/Resource-3_-Ministry-of-Enviromental-and-Climate-Change-Statistics.pdf
Chapter XI: Environmental Statistics, 2022 source Ministry of Environment and Climate Change, page 6.
Then the teacher will provide resource 3 to each small group of students. The teacher will explain to the students that in their group they will discuss and share what they think the data means. Then they will create an explanatory poster that demonstrates the Annual Average of Air Quality in the three Doha cities (Al Corniche, Qatar University and Aspire Zone). They can represent it in a way that they understand how they interpreted the data. Students are encouraged to add questions to their posters, if they feel there is something interesting that they would like to find more about.
Student friendly guiding questions
Who is this data collected by?
What are the four pollutants?
What are the three locations that the data is representing?
Which year is the data referring to?
What do you understand about the description of the Air Pollutants indicator? What does the scale clean to extremely polluted refer to?
In what other way could this data be presented?
Reflection/Action
Students will be invited to share their posters with their peers. Together as a class the teacher will demonstrate on the whiteboard using the mathematical grid paper, or grid flipchart paper to the students how this information could be placed on a bar chart. The teacher will invite suggestions from students to come to the board to explain. The teacher will clear any misconceptions without faulting their mistakes as this is part of their learning process. Let them know it is okay to make a mistake. Understanding and inspiration is the key here.
Checking for Understanding
Learning engagement 1: Identifying and understanding the impact of air pollution.
Check understanding from the student’s responses from their scenarios.
Learning Engagement 2: Interpreting and analyzing air pollutants statistical data.
Check understanding from student poster presentations.
Differentiation
Mixed ability groups.
Key Vocabulary
air, air quality, carbon monoxide, climate, dirt, dust, environment, fog, gaseous, ground level ozone, health, nitrogen dioxide, ozone, particulate matter, pollutants, pollution, sulfur dioxide, sustainable
Resources
Resource 1: See, Think, Wonder Activity: https://rasekh.qa/wp-content/uploads/2024/08/Resource-1_-See-Think-and-Wonder-Activity.pdf
Resource 2: Environment Scenarios: https://rasekh.qa/wp-content/uploads/2024/08/Resource-2_-Environment-scenarios.pdf
Resource 3: Ministry and Environment and Climate Change Statistics: https://rasekh.qa/wp-content/uploads/2024/08/Resource-3_-Ministry-of-Enviromental-and-Climate-Change-Statistics.pdf
Chapter XI: Environmental Statistics, 2022 source Ministry of Environment and Climate Change, page 6.
Resource Publisher
Ministry of Environment and Climate Change
The Ministry of Environment and Climate Change is a service ministry that specializes in achieving many goals, foremost of which is protecting the environment, preserving its resources and reducing emissions that cause climate change.
